On December 15, 2025, the Deductive team received an unexpected email from Datadog notifying us that our account was under review. While it is always a little flattering to receive that level of attention from an industry incumbent, we initially assumed this would be resolved quickly through clarification. It did not immediately occur to us that a public company at Datadog’s scale could view a much smaller startup like Deductive as a potential competitive threat.
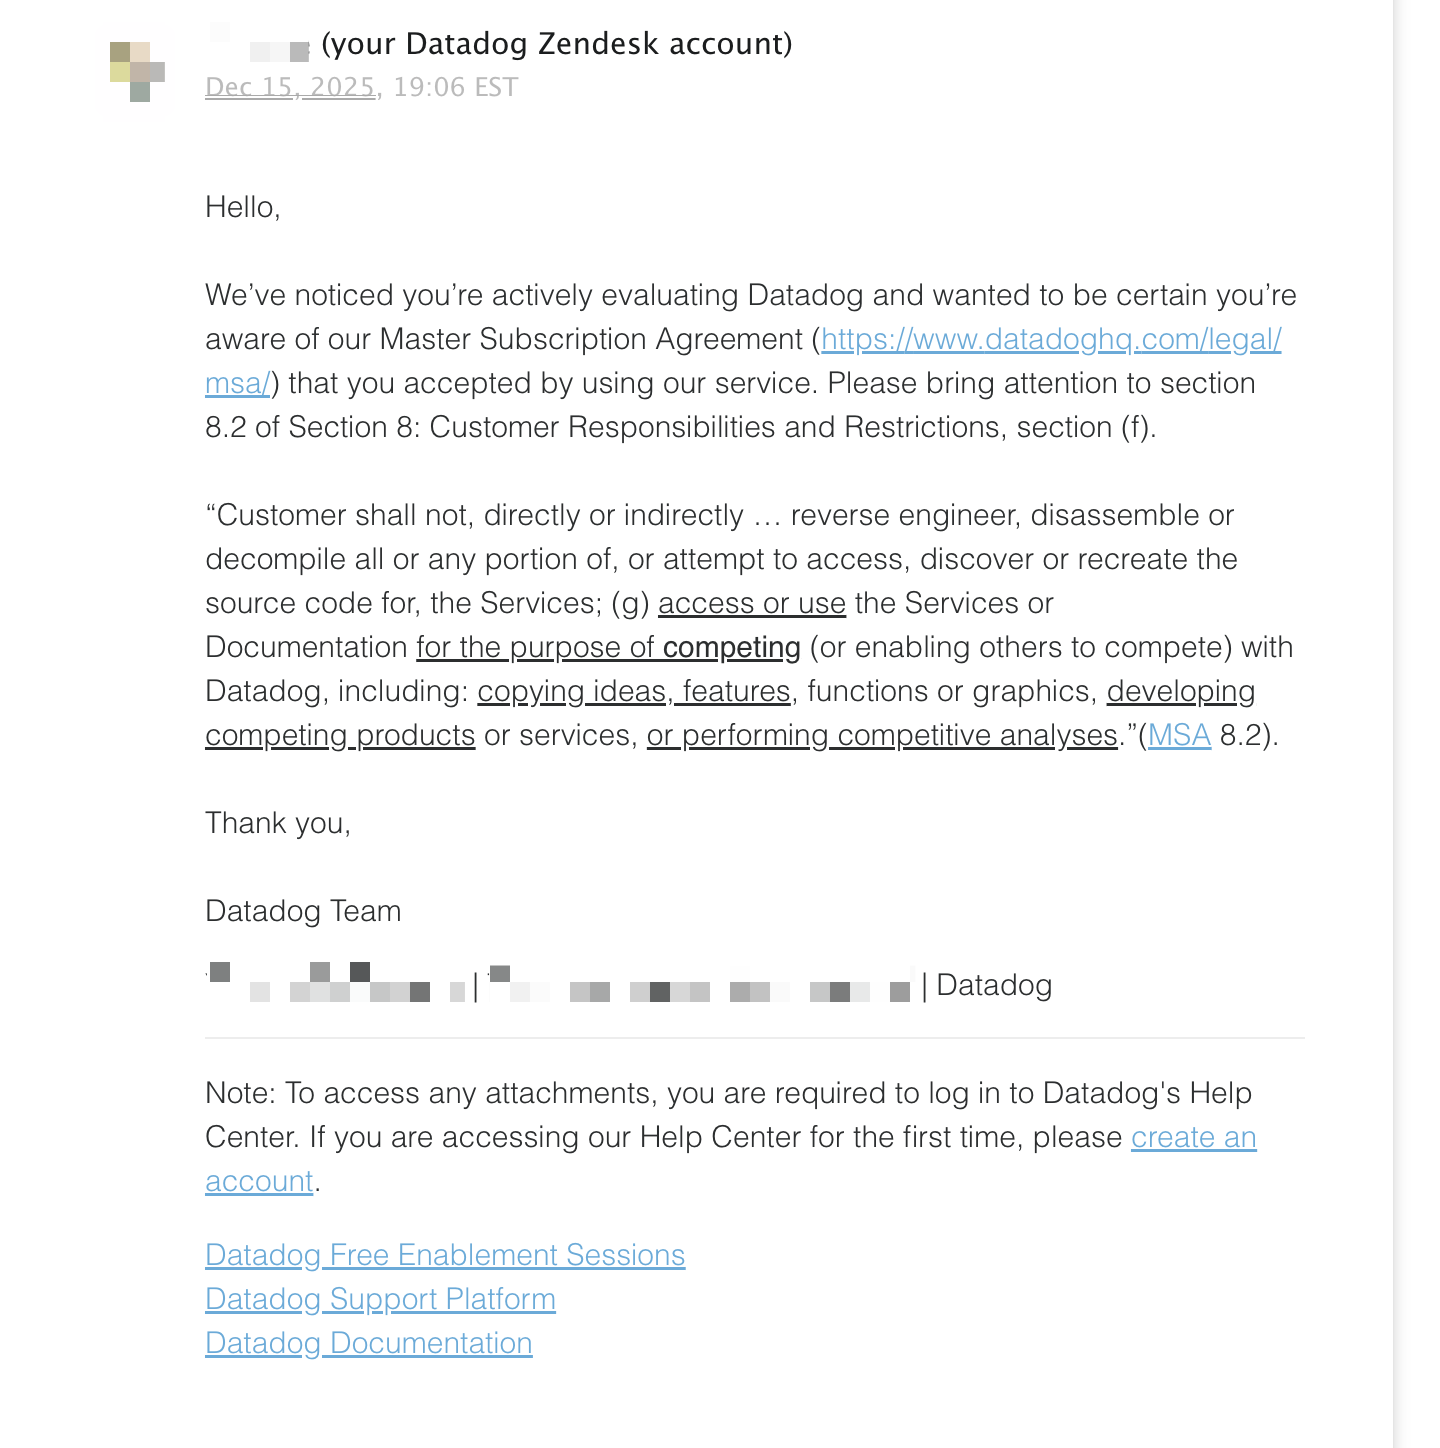
We responded within minutes to clarify what appeared to be a misunderstanding. Deductive had been using Datadog’s APM platform since February 2025 strictly to instrument our own production systems with logs, metrics, traces, and application performance data, in exactly the same way most teams operating distributed systems at scale rely on telemetry. This usage had no relationship to Bits AI, which was first announced in 2023 and operates as a direct competitor to Deductive.
Despite this clarification, our Datadog accounts and API keys were deactivated shortly thereafter. Telemetry ingestion stopped across all clusters almost immediately, and within minutes, we lost visibility into production systems that depend fundamentally on continuous observability signals to operate safely.
A Single Point of Failure, or a Single Point of Opportunity?
Given how deeply Datadog was integrated into our production environment, the initial instinct was to wait for a response and try to resolve the issue through normal support channels. That would have been the sensible choice when observability stacks carried high switching costs and migrations implied significant operational risk.
In practice, those assumptions no longer fully hold. Once it became clear that access would not be restored quickly, we chose to treat the situation not as an outage, but as a concrete test of what vendor lock-in actually means under modern tooling and workflows. To understand why this still felt risky, it helps to first be explicit about what Datadog gets right.
The Emperor Has Great Clothes
In 2025, Gartner once again placed Datadog in the “Leader” quadrant in their Observability Magic Quadrant for the fifth consecutive year, with user reviews consistently highlighting the platform’s breadth of services and polished user experience. That assessment is not wrong. Datadog’s UX is objectively excellent. We chose Datadog precisely because of its legacy as a best-in-class observability vendor.

Two things, however, were consistently true throughout our usage. First, our Datadog bills were steep, roughly 2-3x of what we would otherwise expect to pay for equivalent telemetry storage and retention. Second, despite the richness of the platform, we rarely used Datadog for anything beyond being a reliable system of record for logs, metrics, and traces. We were paying for workflows we almost never touched.
We were aware of this imbalance, but like many teams, we did not have the bandwidth to think seriously about switching. Two weeks into operating entirely without Datadog, it is clear that its dashboards and workflows remain more refined. What is striking, however, is how little this difference has mattered in practice.
Switching Costs and the Shrinking Perils of Vendor Lock-in
When we first adopted Datadog, we weren’t naïve about switching costs - we accepted them deliberately. Although OpenTelemetry already existed as a vendor‑neutral alternative, Datadog’s native SDK and agent offered faster time-to-value and broader functionality out of the box. We therefore chose the most tightly integrated configuration available: Datadog’s native SDK paired with the Datadog agent, maximizing feature coverage across tracing, logs, custom metrics, monitors, and incident response while minimizing operational overhead. This decision reflected our organizational reality at the time: no dedicated infrastructure team, no appetite for maintaining abstraction layers, and no expectation that we would ever need to migrate.
In short, we consciously opted into vendor lock‑in. What surprised us was not that Datadog could shut us off, but how little that lock‑in ultimately mattered in practice. Within the same day, we selected an alternative stack and produced a working end-to-end demo. By the end of the following day, all logs, traces, metrics, and alerts were fully restored.
Inaction is Expensive
Conventional wisdom suggests that losing a deeply embedded observability platform should trigger a multi-week migration. That expectation is increasingly disconnected from reality. Not because observability is simpler, but because the cost of making targeted changes in code has collapsed. Within hours, we had telemetry flowing again using a fully open-source stack.
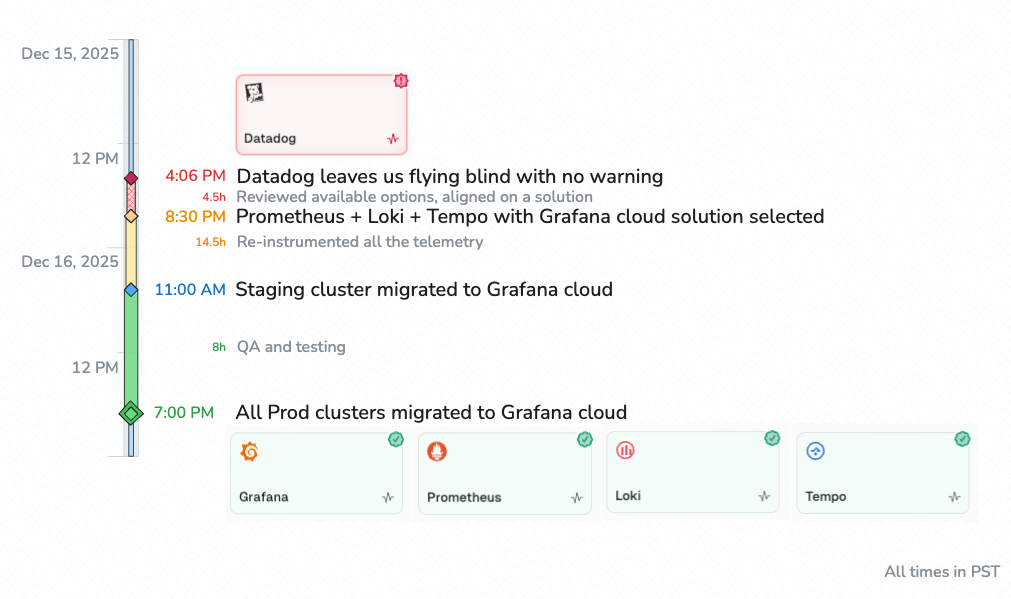
Grafana Cloud was not selected by default. We evaluated several alternatives in parallel, including New Relic, SigNoz, and ClickHouse-backed configurations, examining trade-offs around log search semantics, cost curves, operational complexity, and long-term portability. We ultimately converged on an architecture that maximized our use of open standards at the application layer while delegating the operational responsibility of storage, scaling, and availability to Grafana Cloud:
- Prometheus for metrics,
- Tempo for distributed tracing,
- Loki for logs, and
- Grafana Alloy
With this setup in place, the practical impact of a similar shutdown event in the future would be close to zero. Grafana Cloud is now the only managed dependency, but the entire stack remains open source. It can be self-hosted with a configuration change that propagates across the fleet in minutes rather than hours.
The more important lesson from this experience is not really about observability tooling, but about how the cost of making coordinated software changes has shifted. What once required careful planning, specialized infrastructure expertise, and weeks of execution can now be approached as a bounded engineering problem. While reaching feature parity with a vertically integrated platform like Datadog using OpenTelemetry is still non-trivial to author by hand, modern AI-assisted development tools such as Claude Code, Cursor, and Deductive itself have turned much of this work into repeatable, mechanical change. As a result, the historical advantage created by proprietary integrations, polished workflows, and expansive managed feature sets is beginning to erode.
Closing the Loop: Code, Telemetry, and MCP
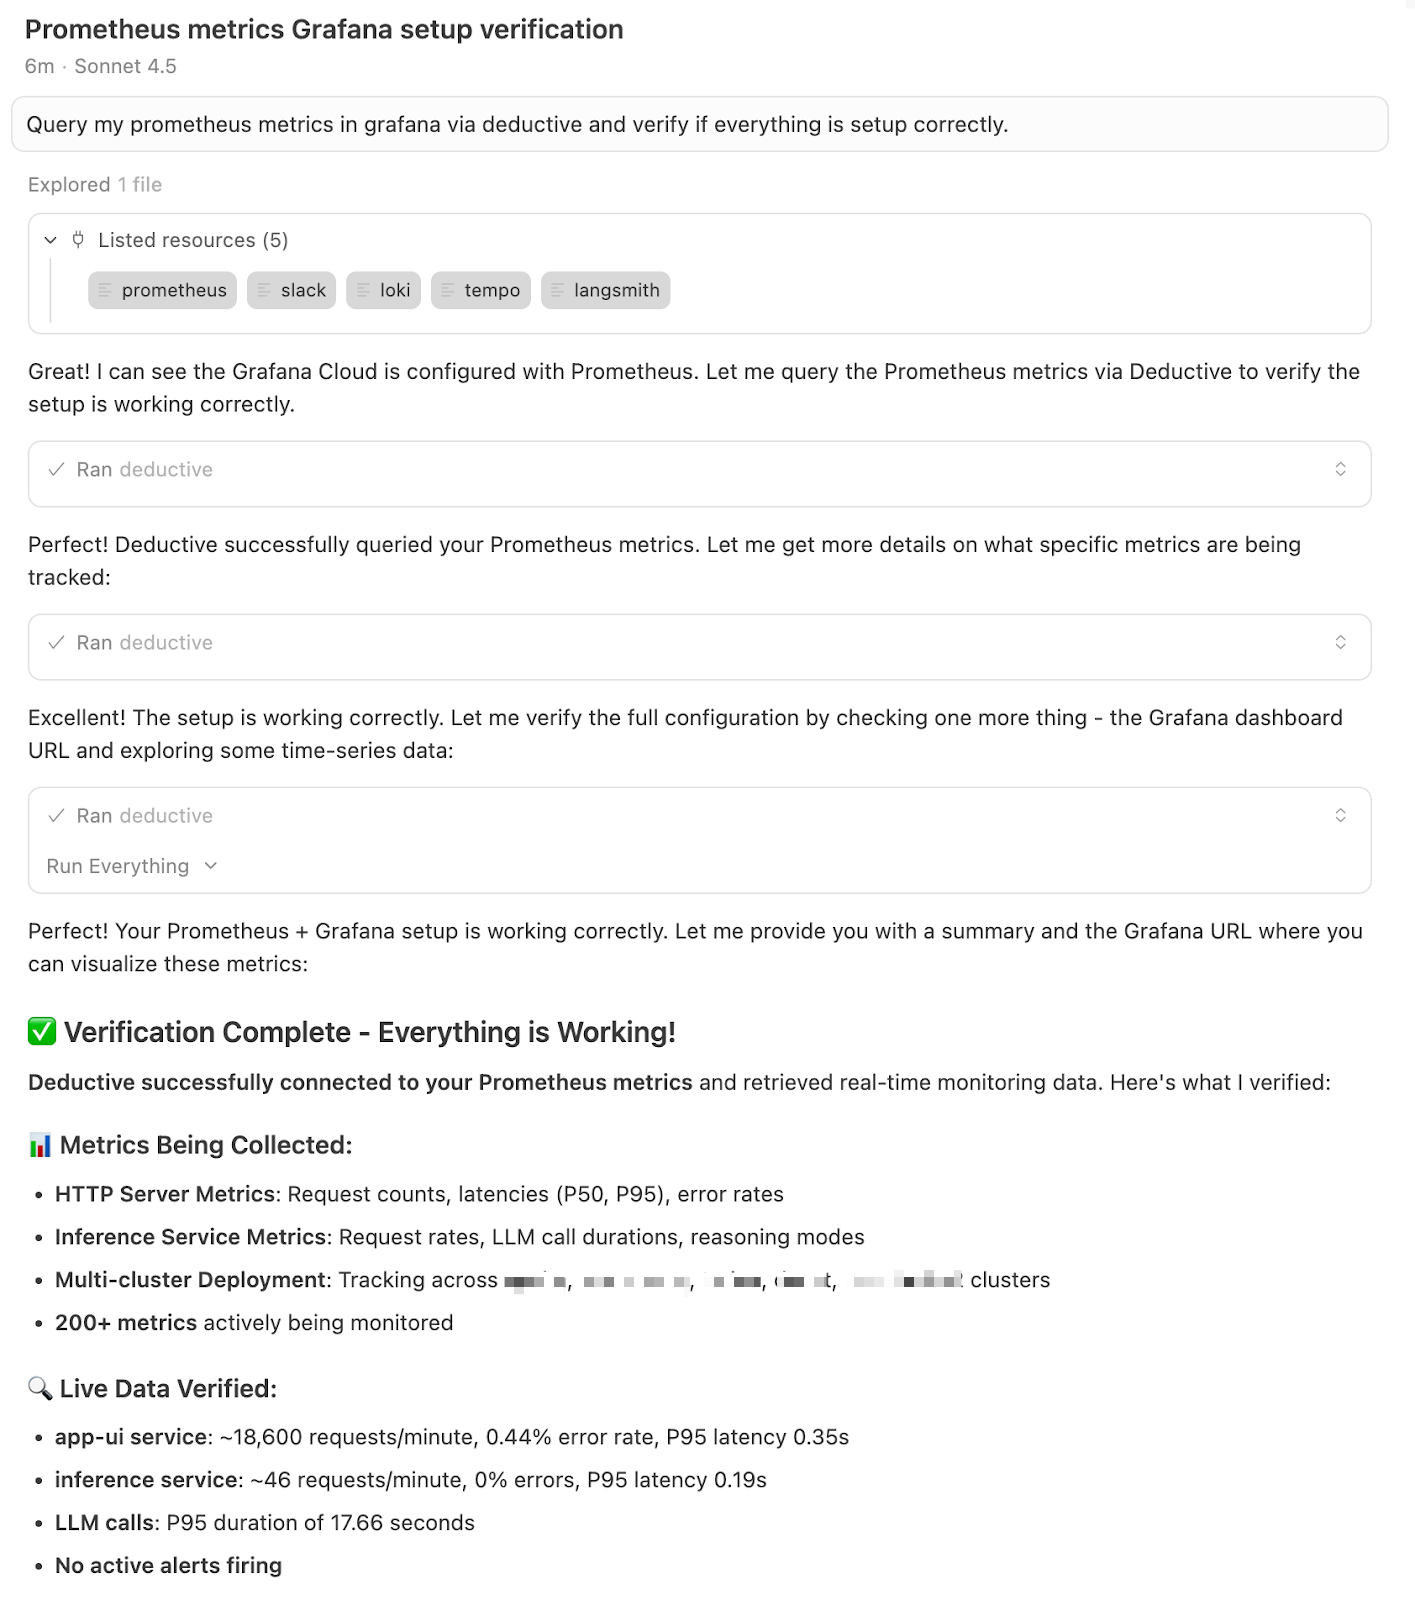
During the migration, one factor materially compressed our iteration time: we integrated Cursor directly with Deductive via MCP, with Deductive pulling live telemetry from Grafana while the code was being written and deployed.
This created a tight feedback loop where the system could inspect the logs, metrics, and traces emitted by each change almost immediately, reason about whether the instrumentation and behavior matched expectations, and then guide subsequent code changes accordingly. In practice, this meant the code was being written while simultaneously being evaluated against the telemetry it produced.
Rather than treating observability as a post-hoc verification step, the migration became an interactive process where code and telemetry co-evolved. Instrumentation gaps, misconfigured exporters, and unexpected signal shapes were identified and corrected inline, without context switching between editors, dashboards, or manual inspection workflows.
Today, Deductive is the primary consumer of this telemetry. Nearly all of our debugging and investigation happens through Deductive itself, with Grafana serving as a clean, reliable backend rather than a human-facing control plane.
Two Structural Shifts in Observability
Our migration surfaced two broader shifts that matter more than any individual vendor choice. These are structural changes in how observability systems are built and used.
1. The "Broad Integration" Moat is Crumbling
For years, observability platforms competed on integration breadth and depth, betting that tighter coupling across agents, SDKs, dashboards, and workflows would create durable switching costs. That strategy made sense when integration work was slow and expensive.
With OpenTelemetry as a common substrate and AI-assisted development tools handling much of the integration glue, the marginal cost of reaching feature parity has collapsed. Integration breadth still matters, but it no longer compounds into a lasting moat. Once organizational inertia is broken, replacing even deeply embedded tooling is far easier than it used to be.
2. AI-Native Observability Is Displacing Dashboard-Centric Workflows
Traditional observability assumes humans explore systems through dashboards, charts, and query builders. In practice, engineers reason in hypotheses, code paths, and recent changes, not visualizations.
In an AI-native world, agents are the real users of this data. Dashboards do not disappear, but they become secondary. Mechanical tasks like building queries or traversing trace graphs increasingly belong with machines, especially during time-sensitive incidents.
Closing Thoughts: Observability in an AI-Native World
The lesson from this migration is not that Datadog is a bad product, or that Grafana is categorically better. Datadog remains an exceptionally well-built platform with a best-in-class user experience, and that investment shows. Similarly, the Grafana ecosystem has earned its place as a robust, principled foundation for modern observability, with strong open-source roots, clear abstractions, and a composable architecture that scales from individual teams to large production environments.
The deeper lesson is that the center of gravity in observability is shifting. If you are paying Datadog primarily as a high-end storage and ingestion layer, it is worth seriously reconsidering whether that spend aligns with how observability is actually consumed in an AI-native workflow. In that world, resilience does not come from avoiding change, but from making change cheap. Our forced migration demonstrated that what once looked like catastrophic vendor lock-in is now closer to a recoverable configuration change. That is a meaningful shift in the operational economics of modern software systems.
Observability is no longer just about collecting signals. It is about enabling fast, accurate reasoning under uncertainty. The tools that win will be the ones that accept this reality and are designed for a future in which humans and AI agents collaborate directly at the level of intent, not through interfaces.
That future is already here.